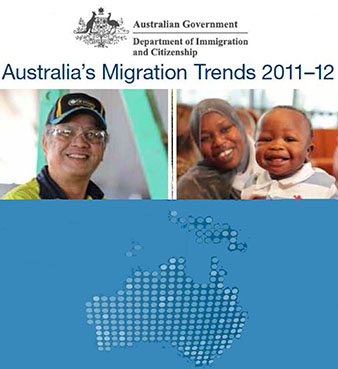
August 2013. The Third World colonization of Australia has continued apace and up to 25 percent of the population there is now of non-European origin, according to an analysis of new immigration figures released by the government.

The report, titled “Australia’s Migration Trends 2011-12,” also revealed that Indians, not Chinese, now make up the single largest group of immigrants to that nation.
According to the report, at least six million of Australia’s total population of 22.5 million were not born in that country.
The report goes on to say that the vast majority of these are from non-European nations—and that even those who are, are dwarfed by the second and third generation born Third World immigrants and their descendants who are not officially classified as “born outside Australia.”
In effect this means that the white European element of Australia’s population has declined from over 90 percent only a few decades ago to around 75 percent.
Australia’s combined migration and humanitarian programs totaled 198,757, an increase of 8.9 percent on the 2010–11 figure (182,452).
China was number two as visa places fell from 29,546 to 25,509 last year.
During the same time United Kingdom arrivals rose to 25,273 from 23,931.
Immigration Minister Brendan O’Connor said Asia is becoming the leading source of permanent migration.
“Seven of the top 10 source countries in 2011-12 were located in the Asia region,” he said in a statement.
During the past 15 years, the number of Indian-born Australian residents has increased fourfold while Chinese-born residents have tripled.
Of this, 93.1 percent came under the Migration Program (184,998)—68.0 percent through the Skill Stream (125,755), 31.7 percent through the Family Stream (58,604) and 0.3 percent under Special Eligibility (639)—and 6.9 percent through the Humanitarian Program (13,759).
For the first time India was the main source of new permanent migrants to Australia, accounting for 15.7 percent of the 2011–12 Migration Program, up from 12.9 percent on the previous year.
It also reflected the trend toward an Asian Century with India and the People’s Republic of China the two main source countries for permanent migrants through the Migration Program.
Also reflecting the emergence of an Asian Century is that seven of the top 10 source countries in 2011–12 were located in the Asia region.
In addition to this regulated migration, 44,304 New Zealand permanent settlers came under the Trans-Tasman Travel arrangement, 28.2 percent more than in 2010–11.
For 2012–13, the overall size of the migration and humanitarian programs is set at 210,000 places, comprising 129,250 Skill Stream, 60,185 Family Stream, 565 Special Eligibility and 20,000 Humanitarian places.
Business (Long Stay) visa grants grew by 38.8 percent, and all top 10 source countries experienced increases in 2011–12 compared to the previous year. The Working Holiday Maker Program grew by 15.6 percent to 222,992 grants, the highest number on record.
An ongoing Seasonal Worker Program was established from July 1, 2012, building on the benefits of the Pacific Seasonal Worker Pilot Scheme which concluded in June 2012. The new program will make 12,000 visa places available over the next four years for seasonal workers in certain Pacific island countries to work in low-skilled jobs for up to seven months in a 12-month period.
In 2011–12, inflows of international students increased by 1.0 percent to 253 047 visa grants, the first rise since the peak in 2008–09. The decreases in Student visa numbers in 2009–10 and 2010–11 followed 11 consecutive years of growth in the visa program.
In 2011–12, there were 7379 refugee status determination requests for asylum seekers who arrived to Australia by boat, a rise of 42.6 percent on the previous year.
Since 2006–07, this figure has grown substantially from only 23 requests to an average of 5715 requests in the last three years.
In June 2012, the Australian Government announced the appointment of an expert panel to provide a report with advice and recommendations to prevent asylum seekers from risking their lives on dangerous boat journeys to Australia. The report was released in August 2012 and the Government agreed to all recommendations in principle.
The implementation of these recommendations was immediate, including the increase of Australia’s 2012–13 Humanitarian Program to 20,000 places, a rise of 45.5 percent on the previous year.
Since September 2005, Net Overseas Migration (NOM) has overtaken natural increase as the main component of Australia’s population growth.
For the year March 2011 to March 2012, NOM added 197,200 people to Australia’s population, or 59.5 percent of growth, an increase of 18.2 percent from the same period the previous year.
Official Population figures from the report:
Estimated resident population (ERP) of Australia (as at March 30, 2012): 22,596,500.
ERP Australia-born population (as at June 30, 2011): 16,294,980.
ERP overseas-born population (as at June 30, 2011): 6,029,070.
Natural increase (at March 30, 2012): 149,600.
Net Overseas Migration (NOM)—preliminary estimate for the year to March 2012: 197,200.
Australian citizen NOM departures—preliminary estimate for 2011–12: 92,500.


